Results:
100%
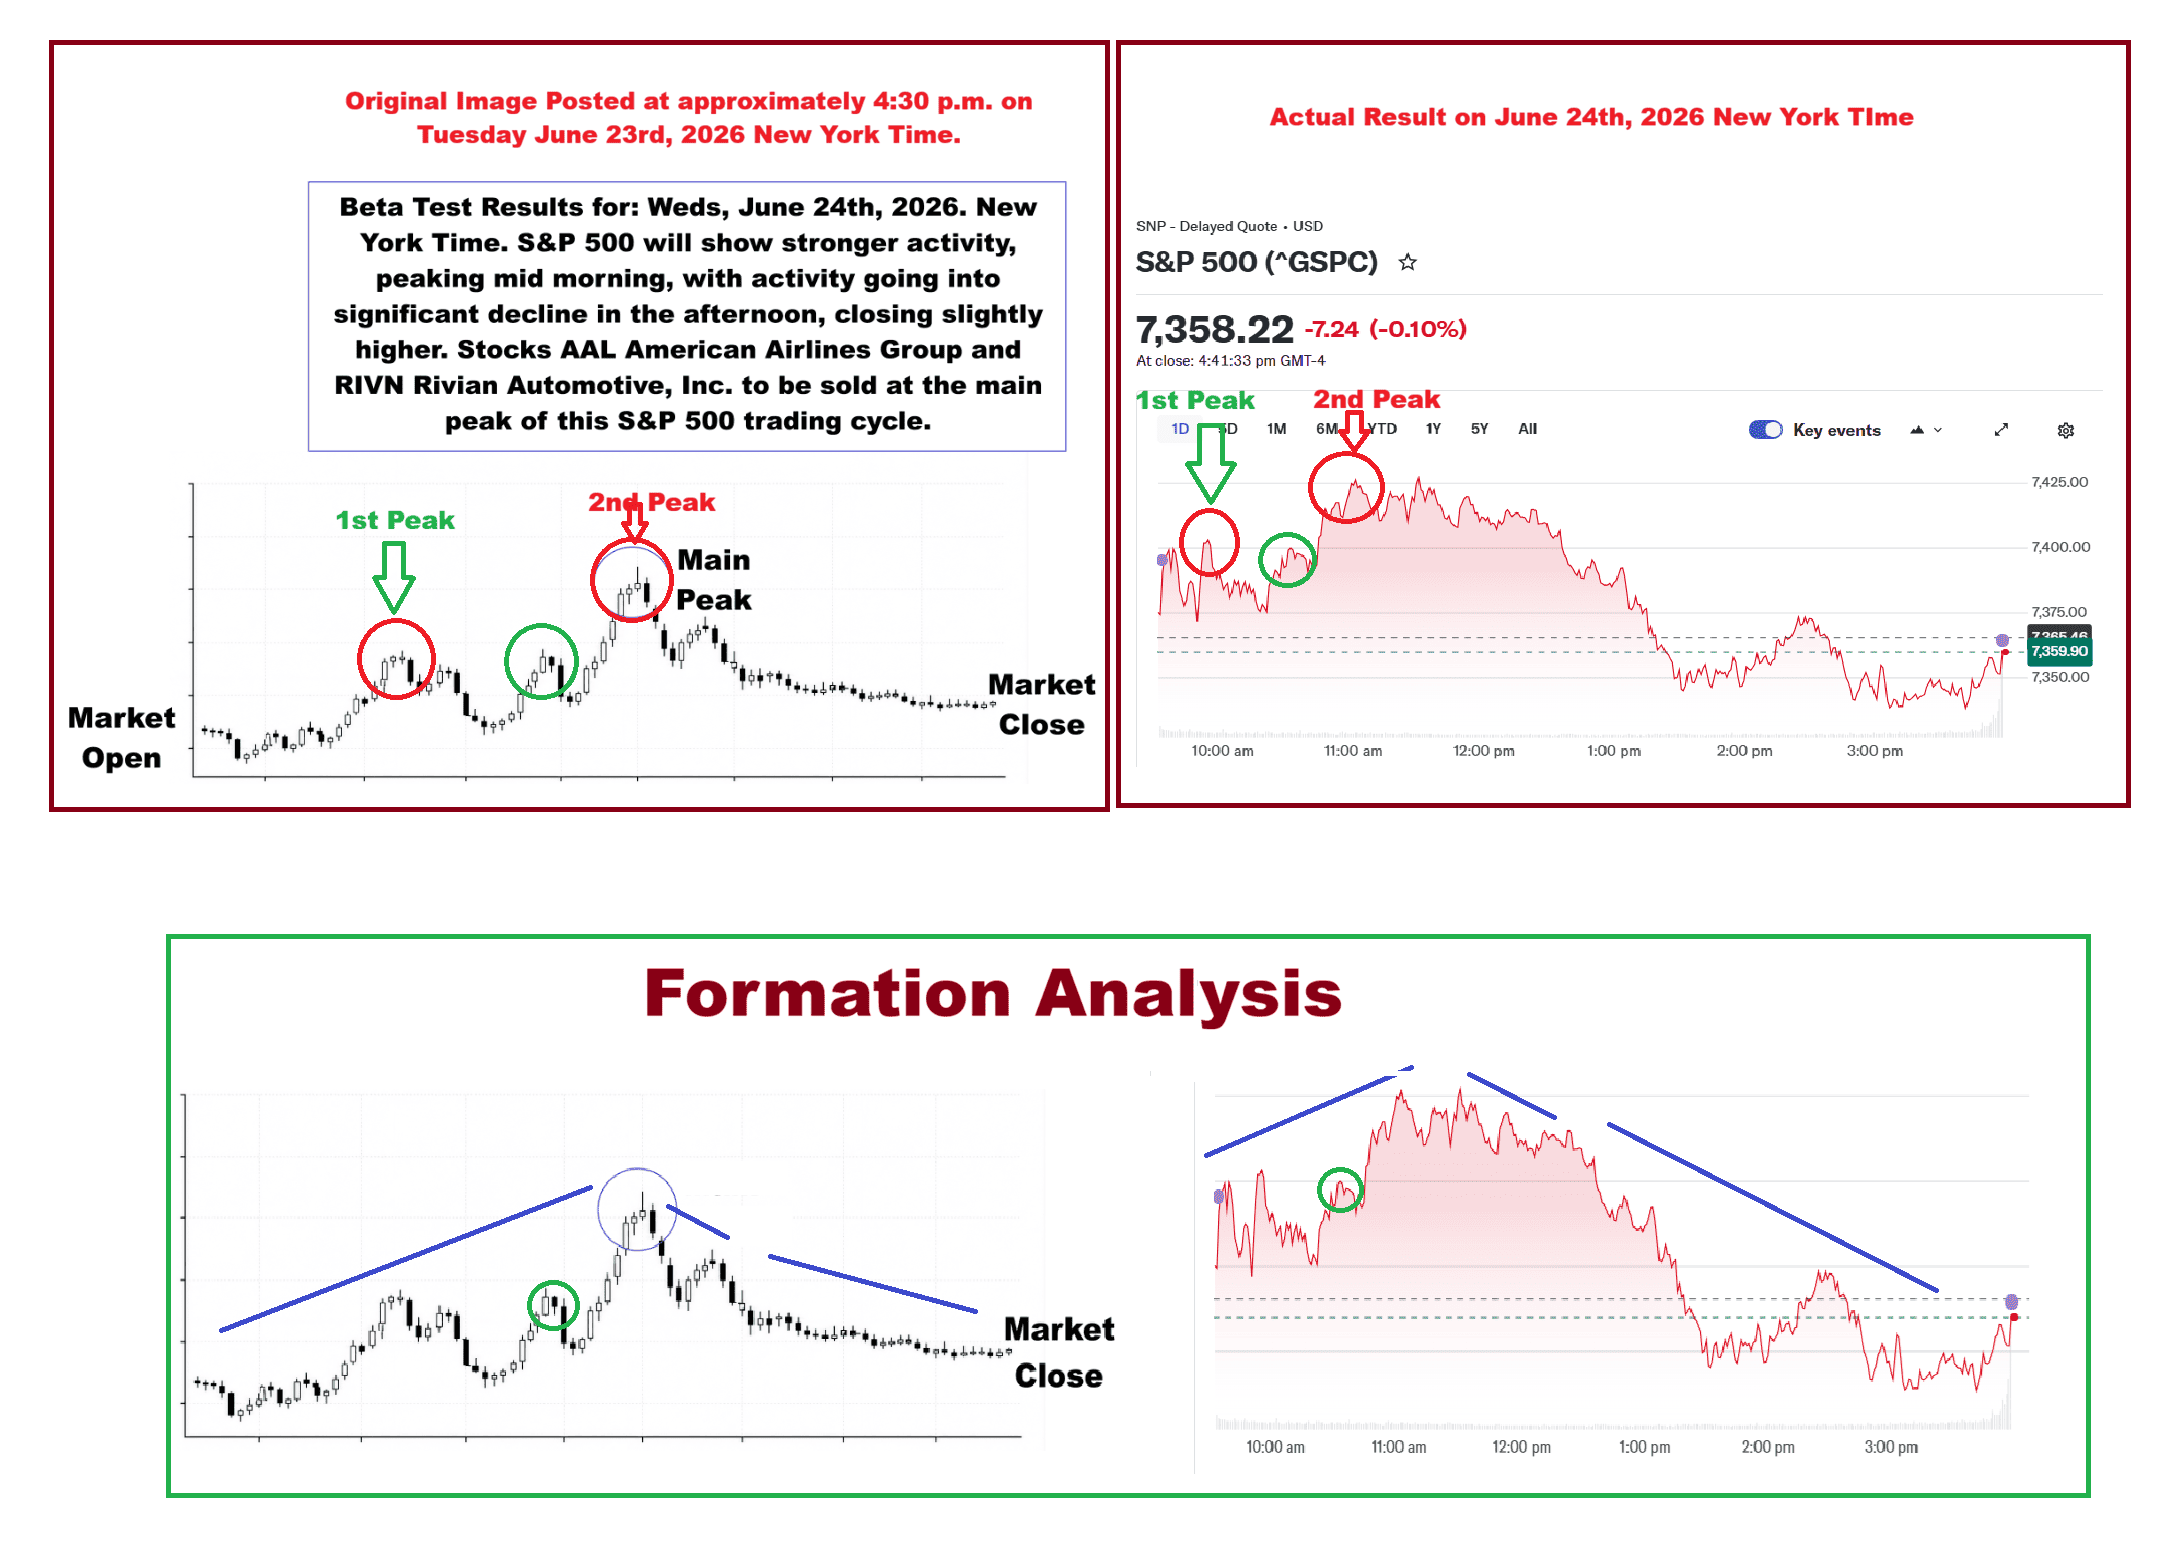
perfect general overal formation. However in the predicted
slightly higher closing, this was incorrect. If we look at the charts
for the day, we see that at 2:30 p.m. there was a slight recovery, but
this was not put in the original forecasting image. This was the first time the original hand drawn chart had been converted to an actual representation of a stock chart using AI. This new procedure will now become part of the protocol (it just looks better!).
Forecated Pattern
Formation Analysis
Now, let's compare the forecasted
beta chart posted at approximately 4:30 p.m. New York Time on Tuesday
June 23rd, 2026.
Overall
Pattern: 100% perfect!. The small green circle would have been
the clue to keep an eye out as the final second peak was approaching.
This was 100% perfect in the forecasted data. As far as errors are
concerned, you can see there is a lag time in the forecasted image that
actually occurred as soon as the markets had opened. The 3 p.m. mild
recovery did not show up on the forecasted beta image. But that does
not matter. If one had paid attention to the second peak and sold at
this point, a nice tidy profit would have taken place.
Now, let's
look at the actual data that was posted and the recommended buy/sell
period. This is where we cut the cheese.
If $1,000 USD had been invested in all three of these stocks as soon as
the markets opened on Wednesday June 24th, 2026:
* S&P 500 Index
* American Airlines Group Inc
( RIVN Rivian Auto
and then sold at the 11 a.m.
forecasted 2nd peak as stated in the original forecast, the following
profits would have been made:
Individual Asset
Performance Analysis Summary:
S&P 500 Index
Purchased at opening: $7,370.88
Sold at 11:00 a.m. Price: $7,424.92
Percentage Gain: $+0.732%
Profit on $1,000:
+$7.33
American Airlines Group Inc. (AAL)
Purchased at opening: $16.46 to $16.47
Sold at 11:00 a.m. Price (10:55 a.m.
snapshot): $17.205
Percentage Gain: $+4.46\%$ to $+4.53%
Profit on $1,000:
+$44.63 to +$45.26
Rivian Automotive (RIVN)
Purchased at opening $14.87$
Sold at 11:00 a.m. Price (10:55 a.m.
snapshot): $15.0853
Percentage Gain: $+1.45%
Profit on $1,000:
+$14.48
Total Profit for a
$1,000 investment: $52.59
Total Profit for a
$1million investment: Between $22,145.65 and $22,357.20 total profit.
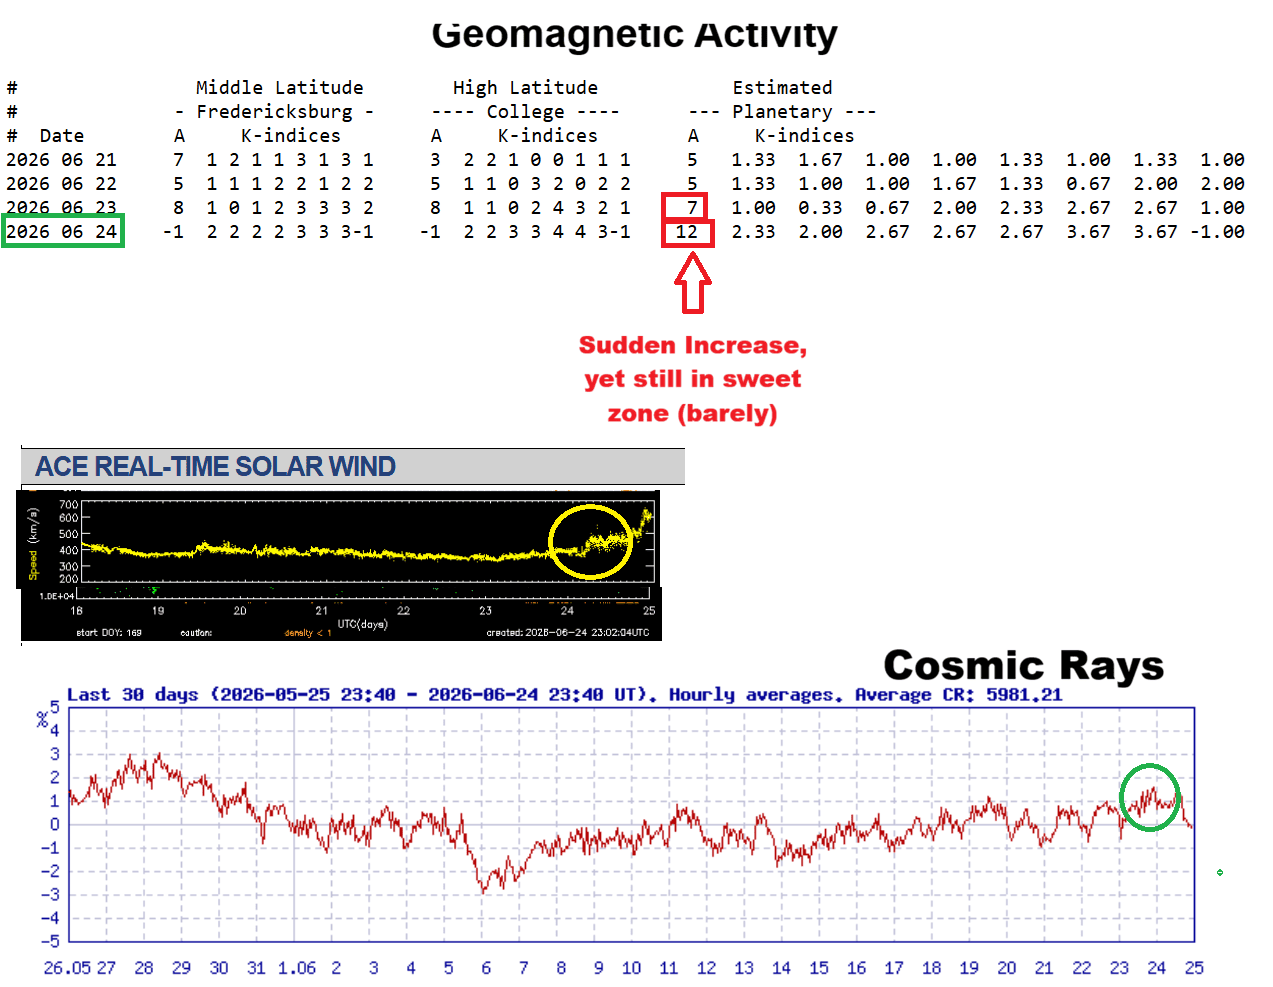
Solar Weather Data Analysis
The sweet spot of geomagnetic
activity was in the sweet spot. However there was an increase in
geomagnetic activity on the target date, which thankfully was in the
sweet spot of geomagnetic activity. This did result in
mild-interferrence on the target date, which caused mild interferrence
from elevated solar wind speed and disturbed 2mev levels. However this
was offset by strong solar weather conditions being in the strong green
range from overal higher cosmic rays. I strongly believe that the
success of the PSI Chips can make up for this slight interferrence. I have made a solar activity App that can now do much of this
work for me. In closing, in
the past beta tests trying to forecast when the S&P 500, stock or
Dow Closes at the exact high or low at end of trading day when this interferrence is
present has
never worked. So in the future, only the overall frequency pattern of
the S&P 500 will be used in these circumstances. The EPS
Summary sheet has been updated and revised to reflect this new
change showing it as geomagnetic activity being slightly higher on the
future date.
Geomagnetic Activity Real Time
https://services.swpc.noaa.gov/text/daily-geomagnetic-indices.txt
Cosmic Rays
https://cosmicrays.oulu.fi
Solar Wind Speed
https://www.spaceweather.gov/products/ace-real-time-solar-wind
S&P 500 Chart Yahoo
https://au.finance.yahoo.com/quote/%5EGSPC/
American Airlines Stock Chart
https://au.finance.yahoo.com/quote/AAL/
RIVN Auto Stock Chart
https://au.finance.yahoo.com/quote/RIVN/
And in finality, I would like to
thank those of you having the patience to return to this month's
session, as last month there was a memorial day holiday. I am not based
in the U.S.A. so we don't get to hear about this holidays. Once again
the
EPS Summary sheet has been updated accordingly.
All in all, this early technology is
starting to prove itself worthwhile and I believe with further
attention to detail 100% continued success is certain. Best of all
instead of the hours of preparation it used to take and deploy this
technology, it now only takes around 20 minutes. with another 20mins of
planning to find the exact favorable day during Time-Gate.
Original Image Posted at
approximately 4:30 p.m. on Tuesday June 23rd, 2026 New York Time.
https://www.in2itivetech.com/beta_tests_into_pre_trial_runs/june_24_26_tech_data_output.png
Important
Notice: You may need to refresh
this page or
clear out your web brower cache to review the latest information posted
to this page.
All beta test dates are subject to change
depending upon entanglement conditions, which can vary. See the analysis
page for further info.
DO NOT BUY ANY STOCKS SHOWN
ON THIS WEBSITE
AS THIS IS AN
EXPERIMENTAL / TESTING PROJECT UTILIZING QUANTUM
ENTANGLEMENT TECHNOLOGY THAT IS IN THE TESTING PHASE. WE ARE NOT
CERTIFIED FINANCIAL PLANNERS NOR RECOMMEND FINANCIAL ADVICE - - - -- - - IN
THE FUTURE WHEN THIS TECHNOLOGY MATURES AND CONSISTENT REPEATABLE
RESULTS ARE OCCURING FOR A MINIMUM OF 3 TO 6 MONTHS, THAN WE WILL BEGIN
PHASE 2.
